First, a few frequently asked questions:
Why did different areas increase different amounts?
We look at sales within neighborhoods when we set values. Some neighborhoods will sell higher than others. For example, if I build two identical homes, one at the lake and one in Ardmore, the one at the lake will sell for more than the one in Ardmore. The same can be true within a town. In Hot Springs a house by the school or Butler Park will sell for more than that same home if located by the waste treatment plant.
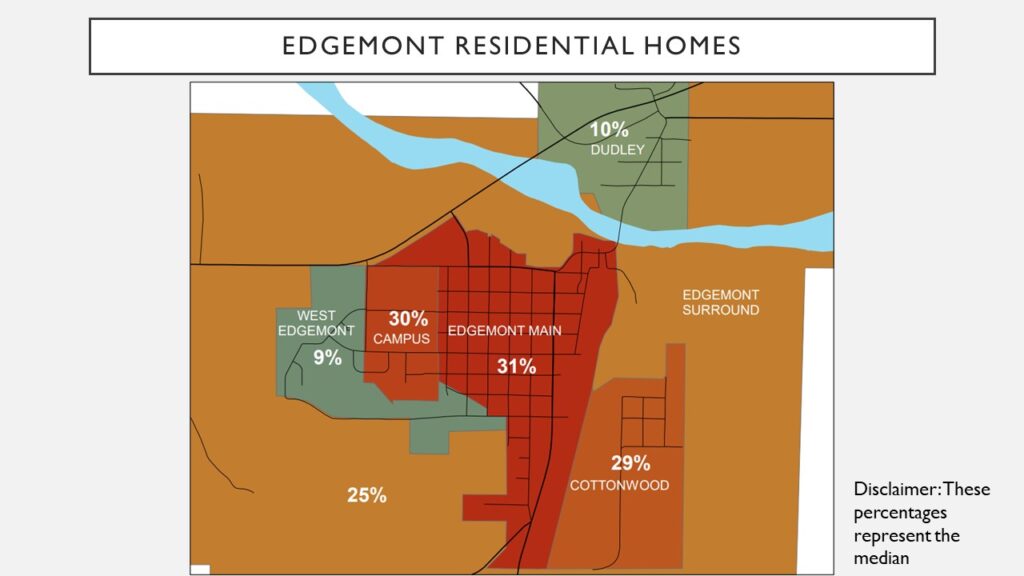
The change we saw in 2021 was that some areas where people had paid lower values for home in the past were no longer seen as ‘less desirable’. For example, in Edgemont, in the past homes on the west side of Edgemont and around the school had always sold for more than those in the main section of Edgemont. In 2021 it didn’t seem to matter where the home was located in Edgemont. So, while everyone saw an increase, on the west side of Edgemont where the values were already higher that increase was not a great.
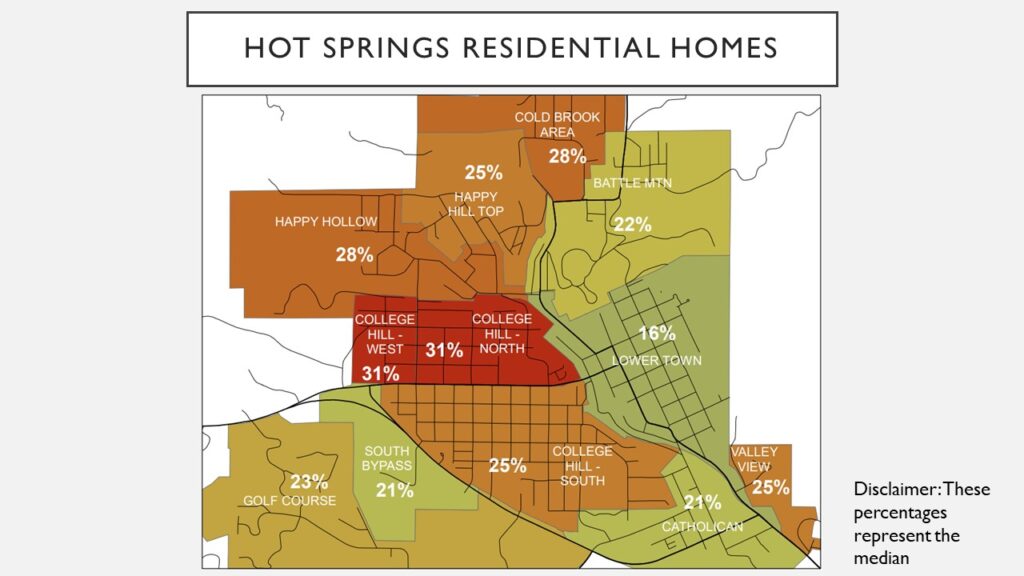
This same scenario happened in Hot Springs where the area called ‘Lower Town’ has seen higher sales than other areas for the last few years. They went up again this year, but because they were already valued higher their increase this year was not as great as other areas.
Why are percentages lower at the lake and the golf course?
Partially for the reasons listed above as to why different areas increased different amounts. Also, when you have a larger value it takes more increase to create that percentage change. For example, if a $50,000 home increases $15,000 that is a 30% increase. A $250,000 home would need to increase $75,000 to see a 30% increase.
Why do we have to increase at all?
State law requires counties to value property based on its market value. Property values must be between 85-100% of what they would sell for on the open market.
What is a median?
Median means the middle value. Averages can be skewed by having one or two extremely large or small values, especially in a small group of data. Median is more representative of what a ‘normal’ property will do. However, it is important to note that median also means that half of the numbers are above that number while half are below.
Value increases for 2022
Edgemont
Residential Homes will see a 19%-30% increase with a median increase of 29%.
Hot Springs
Residential Homes will see a 10%-38% increase with a median increase of 24%.
Areas around Hot Springs
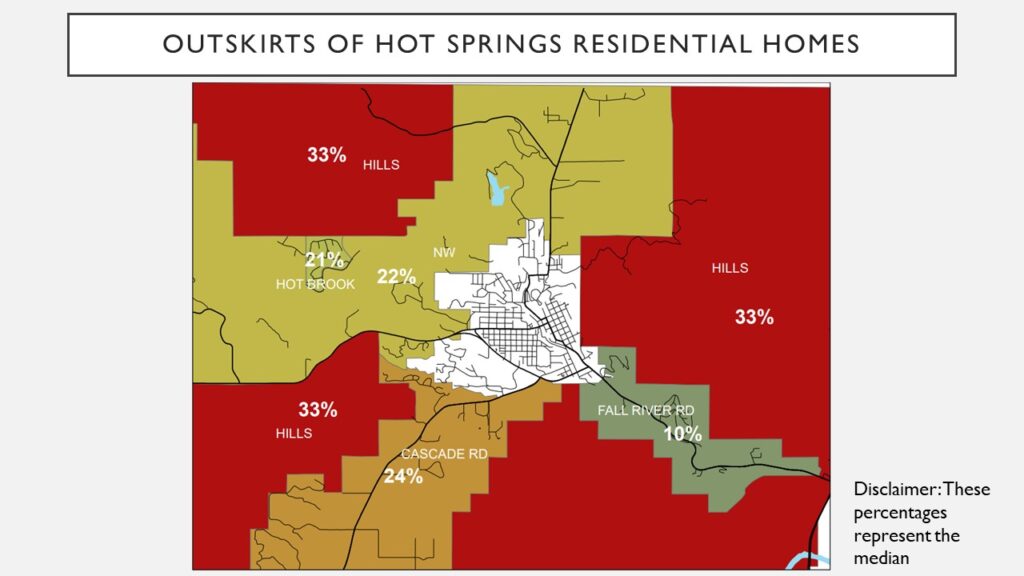
Residential Homes in the Cascade Road area will see a median increased of 24%. While those north and west of Hot Springs will see a median increase of 22%. In the past the more remote areas of the hills had lower market sales than those closer to town. That did not remain true in 2021 and so the Hills area saw a median increase of 33% in their residential homes.
Lake Area
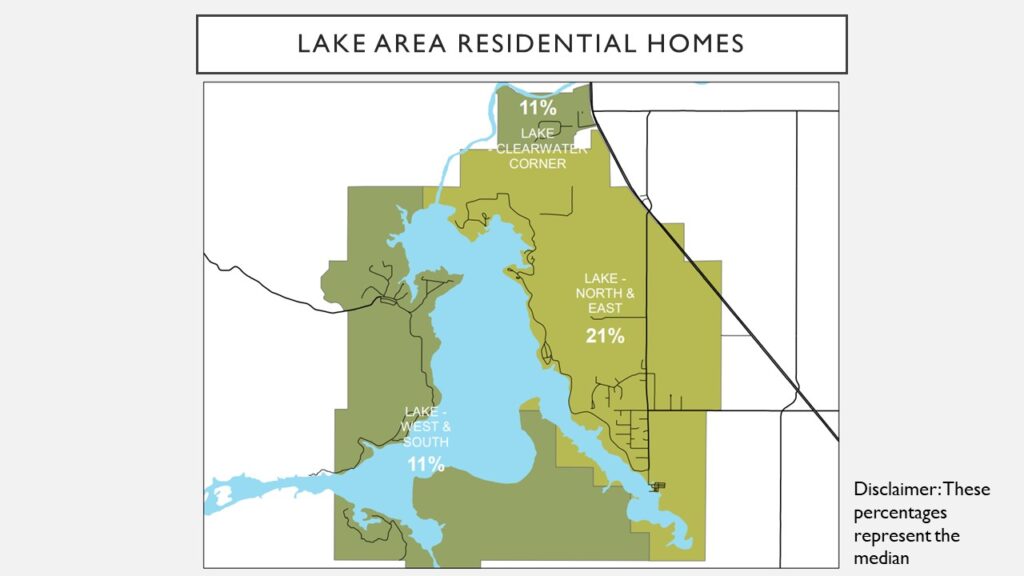
Residential homes on the North and East sides of the lake increased more than those to the West and South and subdivisions lying further away from the lake itself. Vacant land double in valued in most places around the lake.
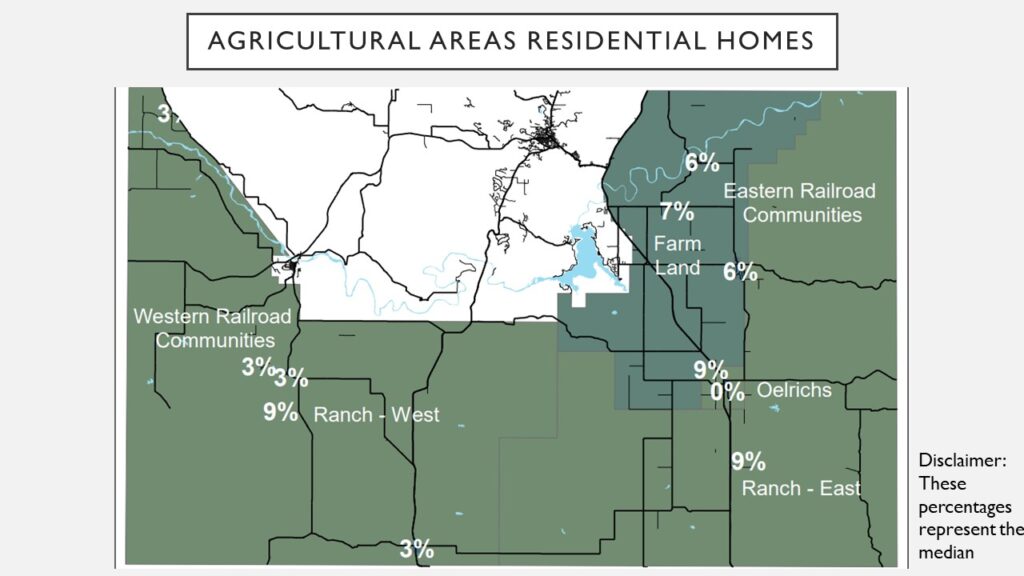
Agricultural Areas and Smaller Communities
Oelrichs remained about the same.
The railroad communities of Smithwick, Oral, Ardmore, Provo, etc saw an average 3-6% increase in residential values.
Rural homes on the plains saw a 7-9% average increase.
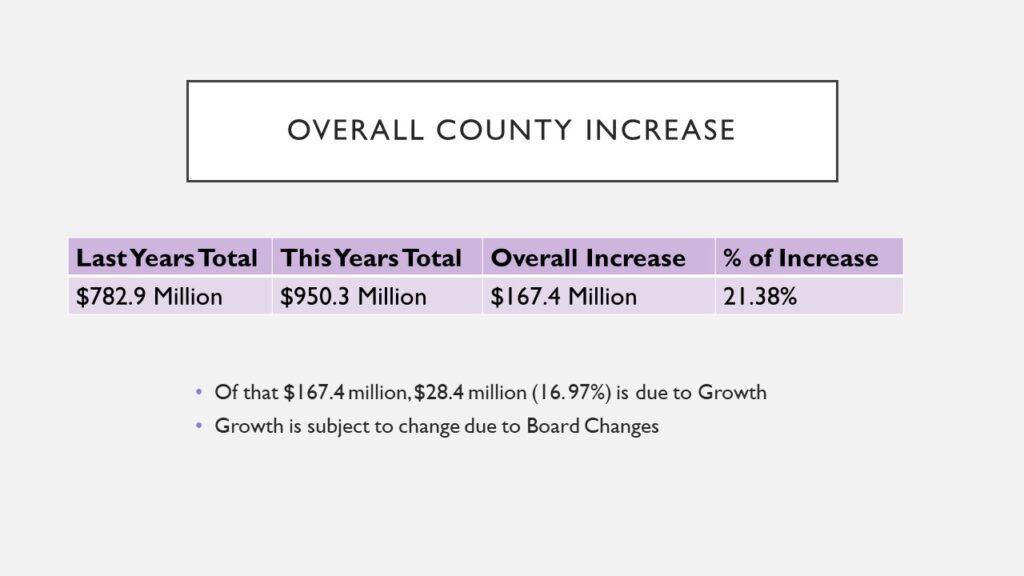
What is Growth?
Growth refers to the increase in value caused by new structures. When someone builds a new house or adds a garage, the value assigned to that structure is growth. Assigning value to something that wasn’t there before.
This is different than a market value increase where the home existed before and has not had any changes but it’s value on the market has increased.
It is important for calculating mill levies and budgets that the difference between value added by new structures and value added by market increases is distinguished. While taxing entities can use the percentage of growth to increase the taxes they levy, they cannot use the market or reassessment value increases.